MySQL Setup
Install MySQL
This section aims to provide a step-by-step guide to setting up a MySQL cluster. Readers can also refer to k8s documentation for more details.
Step 1: Create mysql-pv.yml to build the persistent volume (pv) and persistent volume claim (pvc) for MySQL. You can find the file in the GitHub repository.
Then run the following command to create the pv and pvc:
kubectl apply -f mysql-pv.yml
Step 2: Create mysql-deployment.yml to build the deployment for MySQL. You can find the file in the GitHub repository.
Then run the following command to create the deployment:
kubectl apply -f mysql-service.yml
Step 3: Create mysql-service.yml to build the service for MySQL. Similarly, you can find the file in the GitHub repository.
Then run the following command to create the service:
kubectl apply -f mysql-service.yml
Step 4: Check the status of the MySQL cluster. Run the following command to respectively check the status of the deployments, pod, and service:
kubectl get deployments
kubectl get pods
kubectl get services
Step 5: Port forward the MySQL service to the local machine. Run the following command to port forward the MySQL service to the local machine:
kubectl port-forward svc/mysql 13306:3306
Note: The port 13306 is used to avoid conflicts with the local MySQL service. You can change it to any other port you like.
Step 6: Connect to the MySQL cluster. Run the following command to connect to the MySQL cluster:
mysql -u root -p${password} -h 127.0.0.1 -P 13306
Note: The default ${password} is
pass. You can change it in the mysql-deployment.yml file.
Install Prometheus and Grafana
Step 1: Setup via Prometheus Operator. Since the official documentation is very detailed, we skip this procedure and strongly recommend readers to follow it to setup Prometheus and Grafana.
Step 2: Check the status of the Prometheus and Grafana. Run the following command to respectively check the status of the pods:
kubectl get po -n monitoring
Pleaser make sure all pods are running.
Step 3: Port forward the Prometheus and Grafana service to the local machine.
Step 4: Customize the Prometheus configuration.
Because the default configuration of Prometheus is not suitable for our experiments, e.g., the default retention time is 24h, which is too short for our experiments. We need to customize the Prometheus configuration to meet our needs.
Run the following command to edit the Prometheus configuration:
kubectl edit -n monitoring Prometheus k8s
Then add the retention: 15d under the spec: field.
Readers can also refer to this GitHub issue for more details. To further customize the Prometheus configuration, readers can refer to the official repo.
Step 5: Port forward the Prometheus and Grafana service to the local machine. Run the following command to port forward the Prometheus and Grafana service to the local machine:
kubectl port-forward -n monitoring svc/grafana 3000 --address 0.0.0.0
kubectl port-forward -n monitoring svc/prometheus-k8s 9090 --address 0.0.0.0
Then, you can access the Grafana dashboard via http://localhost:3000 and the Prometheus dashboard via http://localhost:9090.
Step 6: Setup the MySQL exporter. We have provided the configuration file mysql-exporter.yml. Run the following command to create the MySQL exporter:
kubectl apply -f mysql-exporter.yml
Readers can refer to the official repo for more details.
To check whether the MySQL exporter is running, run the following command:
kubectl get svc
Besides, you can also visit http://localhost:9090/targets to check whether the MySQL exporter is running. You should see the following result: 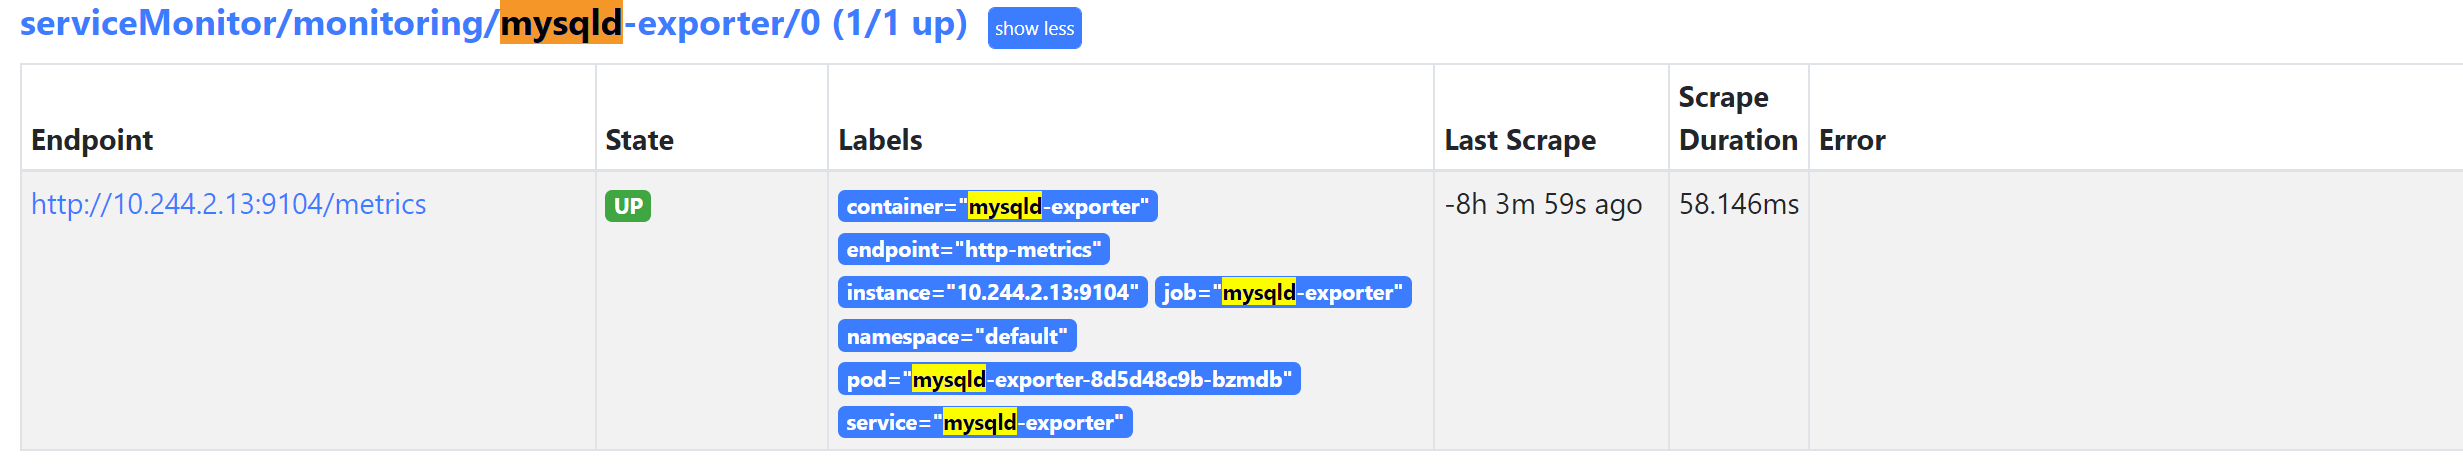
Note that it may take a few minutes for the MySQL exporter to be ready.
Step 7: (Optional) Import the Grafana dashboard.
To visualize the metrics, readers can import the Grafana dashboard from here.
Run benchmark on MySQL
We use TPC-C to simulate the workload of a real-world OLTP database.
To be more specific, we use benchbase to run the benchmark. Readers can refer to the benchbase documentation for more details.
For the configuration of the benchmark, readers can find it in our GitHub repository.
Here are three basic commands to run the benchmark:
- init: Initialize the database.
java -jar benchbase.jar -b tpcc -c config/mysql/sample_tpcc_config.xml --create=true --load=true - exec: Run the benchmark.
java -jar benchbase.jar -b tpcc -c config/mysql/sample_tpcc_config.xml --execute=true - cleanup: Clean up the database.
java -jar benchbase.jar -b tpcc -c config/mysql/sample_tpcc_config.xml --clear=true